
Contents
- Where This All Starts: Reliability and Safety
- What You Need Before You Begin
- FIT Rates and Where They Come From
- FMEDA: What It Is, When to Use It, and How It Works
- Worked Example: Safety Relay Module
- MTBF: What It Is and How It Differs From FMEDA
- Fault Tree Analysis (FTA)
- Markov Analysis
- Common Cause Analysis (CCA) and CCF
- Which Method When: A Quick Reference
- Data Sources: Standards and Handbooks
- What Happens With the Numbers: Goals and Deliverables
1. Where This All Starts: Reliability and Safety
If a system is supposed to protect people (stop a machine when someone presses the emergency button, brake a car when the driver hits the pedal, or shut down a reactor when something goes wrong), we need to know two things: Will it work when we need it? and Will it fail in a safe way if something breaks?
That is where reliability and safety meet. Reliability analysis (RA) asks: "How often do parts fail?" Safety analysis asks: "When they fail, do we get a safe outcome or a dangerous one?" To answer the second question, we need numbers from the first. We need failure rates, we need to know how each part can fail (failure modes), and we need to know whether our design detects those failures (diagnostics). Without that, we cannot prove that our safety function is good enough for a given Safety Integrity Level (SIL), Performance Level (PL), or ASIL.
Goal of this cycle: Use reliability data and a structured analysis (such as FMEDA) to get numbers (SFF, DC, PFH, PFD, MTTFd) that show our product meets the target SIL, PL, or ASIL. Those numbers go into the safety case and into the hands of assessors and customers.
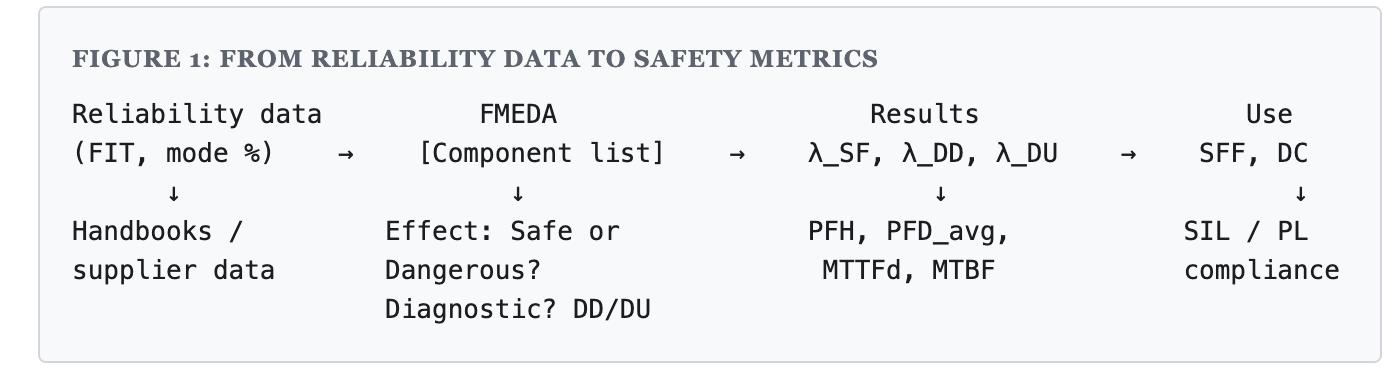
Figure 1: From reliability data to safety metrics
2. What You Need Before You Begin
Before you pick a method, you need to be clear on:
- System boundary: What product or subsystem are you analyzing?
- Safety function: What must the system do to keep people safe? (For example: "De-energize the output relay when the E-stop is pressed.")
- Safe state: What does "safe" look like? (For example: "Output relay open (de-energized).")
- Standard: Are you working to IEC 61508, ISO 26262, ISO 13849, or another? This decides which metrics and targets apply.
You also need a component list (bill of materials) and, for each component, a way to get a failure rate (usually in FIT). That failure rate is an input; it comes from handbooks or supplier data, not from guesswork. The rest of the analysis then splits that rate into failure modes and classifies them as safe or dangerous, detected or undetected.
3. FIT Rates and Where They Come From
FIT means "Failures In Time." One FIT is one failure per billion (109) hours of operation. So a component with 100 FIT is expected to fail once every 10 million hours. FIT is just a unit for failure rate; the Greek letter lambda (λ) is often used for failure rate in formulas.
You do not usually calculate FIT from scratch. You get it from:
- Reliability handbooks: IEC TR 62380 (now superseded by IEC 61709), Siemens SN 29500, MIL-HDBK-217, FIDES. These give base failure rates and factors for temperature, stress, and environment.
- Component supplier data: Some datasheets publish FIT directly.
- Field data: If you have enough operating hours and failure counts, you can estimate λ = (failures / (units × hours)) × 109.
In stress-based models (for example MIL-HDBK-217), the component failure rate is: λ = λb × πT × πS × πQ × πE, where λb is the base rate and the π factors are multipliers for temperature, electrical stress, quality, and environment. The handbooks tell you how to get those factors.
4. FMEDA: What It Is, When to Use It, and How It Works
Figure 2: FMEDA flow (step by step)
- Define system boundary and safe state.
- List components; assign FIT per component (from handbook or supplier).
- Split each component FIT into failure modes using handbook percentages.
- For each mode: classify effect as Safe or Dangerous.
- For each Dangerous mode: is it detected? If yes, assign DC; then λ_DD = λ×DC, λ_DU = λ×(1−DC).
- Sum λ_SF, λ_DD, λ_DU across all components.
- Compute SFF, DC_avg, PFH, PFD_avg, MTTFd.
- Compare to SIL/PL targets and document in the FMEDA report.
What is FMEDA?
FMEDA (Failure Modes, Effects, and Diagnostic Analysis) is a worksheet-style analysis. You take each component, split its FIT into failure modes (e.g. open, short, drift), decide for each mode whether the effect is safe or dangerous, and then ask: "Is there a diagnostic that detects this?" That gives you four categories: Safe Failure (SF), Dangerous Detected (DD), and Dangerous Undetected (DU). (Some standards also use Safe Detected / Safe Undetected; the idea is the same: safe vs dangerous, and detected vs not.)
When do you use FMEDA?
Use FMEDA when you need to demonstrate compliance with IEC 61508 (SIL), ISO 26262 (ASIL), or ISO 13849 (PL). It is the standard way to get device-level or subsystem-level numbers (SFF, diagnostic coverage, λSF, λDD, λDU) that feed into system-level calculations (PFD, PFH) and into the safety case.
What does it need from you, the engineer?
| Input | Source |
|---|---|
| Component list (BOM) | Design |
| FIT per component | Handbook or supplier |
| Failure mode distribution (e.g. % open, % short) | Handbook (e.g. IEC 62380, SN 29500) |
| Effect of each mode (safe or dangerous) | Engineering analysis |
| Diagnostic coverage per dangerous mode | Standards tables (e.g. IEC 61508-2 Annex E) + justification |
| Safe state definition | System requirement |
What is derived?
For each failure mode you get λmode = λcomponent × (mode % / 100).
For dangerous modes, you split that into DD and DU using the diagnostic coverage (DC): λDD = λmode × DC, λDU = λmode × (1 − DC).
You then sum across all components to get total λSF, λDD, λDU, and from those you derive:
- SFF (Safe Failure Fraction): (λSF + λDD) / (λSF + λDD + λDU)
- DCavg: λDD / (λDD + λDU)
- PFH (Probability of Dangerous Failure per Hour): λDU / 109
- PFDavg (low demand): (λDU / 109) × Tproof / 2
- MTTFd (Mean Time To Dangerous Failure): 109 / λDU hours
When is each formula used?
SFF is used to check architectural constraints (e.g. IEC 61508: SFF 60–90% allows SIL 2 at HFT=0; 90–99% allows SIL 3). PFH is used for high-demand or continuous systems (e.g. steering); PFD is used for low-demand systems (e.g. E-stop) and depends on the proof test interval. DCavg and MTTFd are used in ISO 13849 for PL determination.
5. Worked Example: Safety Relay Module
Below is a shortened version of a full FMEDA for a safety relay module used in an emergency stop circuit. It shows how each component is broken into modes, how effects and diagnostics are assigned, and how the numbers roll up.
System definition: Product: safety relay module with microcontroller. Safety function: de-energize output relay when E-stop is pressed. Safe state: output relay open (de-energized). Proof test interval: 1 year (8,760 hours).
Component list (FIT from SN 29500)
| Ref | Component | Total FIT |
|---|---|---|
| R1 | Resistor (pull-up) | 10 |
| C1 | Capacitor (filter) | 20 |
| Q1 | MOSFET (output driver) | 40 |
| U1 | Microcontroller | 100 |
| K1 | Output relay | 80 |
| D1 | Flyback diode | 15 |
| Total λ | 265 FIT |
Example: R1 (Resistor, 10 FIT). Two modes: Open (50%), Short (50%). Open: pull-up lost, microcontroller may not see E-stop; effect is dangerous. Diagnostic: periodic input test by MC firmware; DC 90%. So λDD = 5 × 0.9 = 4.5 FIT, λDU = 0.5 FIT. Short: input pulled to GND, relay opens; effect is safe. So λSF = 5 FIT. R1 summary: λSF = 5, λDD = 4.5, λDU = 0.5.
Repeating this for all components (C1, Q1, U1, K1, D1) with their modes, effects, and diagnostics gives the following totals.
Aggregated results (FIT)
| Quantity | Calculation | Value |
|---|---|---|
| λSF | 5 + 16.2 + 12 + 45 + 40 + 7.5 | 125.7 |
| λDD | 4.5 + 0 + 26.6 + 42 + 39.6 + 0 | 112.7 |
| λDU | 0.5 + 3.8 + 1.4 + 13 + 0.4 + 7.5 | 26.6 |
| λtotal | 125.7 + 112.7 + 26.6 | 265 |
IEC 61508: SFF = (125.7 + 112.7) / 265 = 89.96%. So SIL 2 capable at HFT=0 (below 90% would need more diagnostics for SIL 3). PFH = 26.6 / 109 = 2.66×10⁻⁸/hr (SIL 2/3 boundary). PFDavg = (26.6/109) × 8760 / 2 = 1.16×10⁻⁴ (SIL 3 in low demand).
ISO 13849: DCavg = 112.7 / (112.7 + 26.6) = 80.9% (DC Low). MTTFd = 109 / 26.6 ≈ 37.6 million hours (High). For Category 2, DC Low and MTTFd High give PL c. To reach PL d you would need DC Medium (e.g. add diagnostics to D1 and C1).
6. MTBF: What It Is and How It Differs From FMEDA
MTBF (Mean Time Between Failures) is the reciprocal of failure rate: MTBF (hours) = 109 / λ (FIT). So 100 FIT gives MTBF = 10 million hours. MTBF and FIT are the same information in different units.
When is MTBF used? For availability, mission reliability, and maintenance planning. You use it when the question is "How often will the system fail?" or "What is the probability of surviving a mission of length T?" (R(T) = e−λT).
How is it different from FMEDA? MTBF does not distinguish safe from dangerous failures and does not use diagnostics. A system can have a high MTBF and still be unsafe if most failures are dangerous and undetected. FMEDA is required when you need SIL, ASIL, or PL; MTBF is used for reliability and availability figures. In practice, you often do both: FMEDA for the safety case, MTBF for customer-facing reliability and maintenance.
7. Fault Tree Analysis (FTA)
FTA is top-down: you start from a hazard (the "top event") and work backward to find which combinations of basic events (component failures) can cause it. It uses logic gates: OR (any input causes the output), AND (all inputs must occur).
When do you use it? When you need the probability of a specific hazardous event (e.g. "relay does not open on E-stop") and you have multiple components or channels. FTA consumes failure rates (often λDU from FMEDA) and combines them according to the system architecture.
Relationship to FMEDA: FMEDA gives you λDU (and λDD) per component or channel. FTA uses those numbers at the system level to compute PFD or PFH for the safety function. So FMEDA is done first at component/subsystem level; FTA is done at system/function level and uses FMEDA outputs.
8. Markov Analysis
Markov analysis models the system as a set of states (e.g. working, degraded, failed safe, failed dangerous) with transition rates between them (failure rates λ, repair rates μ = 1/MTTR). You write equations for how the probability of being in each state changes over time and solve for steady state or mission time.
When do you use it? When the system has redundancy, repair, or multiple degraded states and the order of failures matters. Simple formulas (e.g. for 1oo1) do not capture that; Markov does. The downside is that the number of states grows quickly (e.g. 2n for n components), so it is used selectively for complex architectures.
Relationship: Markov can refine PFD/PFH that you would otherwise get from simplified formulas or FTA. It is not a replacement for FMEDA; it uses failure rates (and coverage) that come from FMEDA or similar.
9. Common Cause Analysis (CCA) and CCF
Common cause failure (CCF) is a single cause that fails more than one channel at once (e.g. same power supply, same software bug, same connector). Redundancy assumes failures are independent; CCF breaks that assumption.
CCA is the process of showing that CCF is adequately addressed. In ISO 13849, Annex F gives a checklist (separation, diversity, protection, EMC, etc.); you must score at least 65 points for Category 2/3/4 or PL c/d/e. In IEC 61508, the beta-factor model is often used: a fraction β of failures are common cause, so λCCF = β × λ, and this is included in system PFD/PFH formulas.
When: Whenever you claim redundancy (e.g. 1oo2). CCA/CCF runs in parallel with FMEDA and FTA: FMEDA gives per-channel rates; FTA (or Markov) combines them and adds the beta term or similar; CCA justifies that your design has enough separation and diversity to use that model.
10. Which Method When: A Quick Reference
Figure 3: Which method to use
Do you need to prove SIL / ASIL / PL?
    YES  →  FMEDA (always)

    Is the system redundant or complex (repair, degraded
    states)?
    YES  →  FMEDA + FTA; if needed, add Markov

    Do you need to show redundancy is not defeated by common
    cause?
    YES  →  CCA (ISO 13849 checklist or IEC 61508 beta
    factor)

Do you only need uptime / mission reliability / maintenance planning?
    YES  →  MTBF and R(T) (reliability, not safety metrics)
| Need | Use |
|---|---|
| SIL / ASIL / PL compliance (SFF, DC, PFD, PFH) | FMEDA (mandatory) |
| System-level PFD or PFH with redundancy | FMEDA + FTA (or Markov) |
| Availability, mission reliability, maintenance | MTBF, R(T) |
| Redundant system, repair, degraded states | Markov (in addition to FMEDA) |
| Justify that redundancy is not defeated by CCF | CCA (checklist or beta factor) |
11. Data Sources: Standards and Handbooks
Where each type of data typically comes from:
| What you need | Where you get it |
|---|---|
| Component FIT (base failure rate) | Siemens SN 29500 (by component family), IEC 61709 (electronics), MIL-HDBK-217, FIDES, supplier data |
| Failure mode distribution (% open, short, drift) | IEC TR 62380 / IEC 61709, SN 29500, FIDES, exida SERH, ZVEI/VDA (automotive) |
| Diagnostic coverage (DC) ranges for a measure | IEC 61508-2 Annex E, ISO 13849-1 Annex E: tables that list diagnostic measures and their DC ranges (e.g. watchdog 60–90%, CRC 99%) |
| SIL / PFD / PFH targets | IEC 61508 (Parts 2, 6): tables for SIL vs SFF, vs PFH, vs PFD |
| DC and MTTFd levels, PL | ISO 13849-1: DC levels (None/Low/Medium/High), MTTFd levels, Table K.1 for PL |
| CCF scoring | ISO 13849-1 Annex F: checklist; IEC 61508: beta-factor or similar in system formulas |
Field data, when you have enough of it, can override handbook estimates. You must document the source and justify it in the FMEDA report.
12. What Happens With the Numbers: Goals and Deliverables
Goal: Show that the hardware supports the required SIL, PL, or ASIL so that the safety function meets the target probability of failure (PFD or PFH) and the architecture meets the standard's constraints (SFF, DC, etc.).
What is done with the numbers:
- They go into the FMEDA report (worksheet, aggregated results, formulas, conclusions) that is part of the safety case.
- SFF and SIL justify the hardware fault tolerance and the maximum SIL the subsystem can claim.
- λDU (and sometimes λDD) feed into FTA or Markov to compute system PFD or PFH.
- DC and MTTFd (ISO 13849) determine the achievable PL.
- Assessors and customers use these numbers to judge whether the product is suitable for the application and whether the safety case is complete.
If the numbers do not meet the target, you improve diagnostics, add redundancy, or reduce λDU (e.g. by choosing more reliable parts or better failure mode coverage) and re-run the analysis until the goals are met.
This guide is based on IEC 61508, ISO 13849, ISO 26262, and common practice in functional safety. For formal compliance, always refer to the applicable standards and your notified body or assessor.